Hello Together
With some delay because of the bad internet coverage here in Down Under comes the next update.
The last two weeks we have devoted ourselves completely to the financial charts. These had previously only been implemented as temporary displays. Createjs offers complete freedom because there are no pre-built objects either. Therefore we have improved the axes labels and the legend of our previous tables.
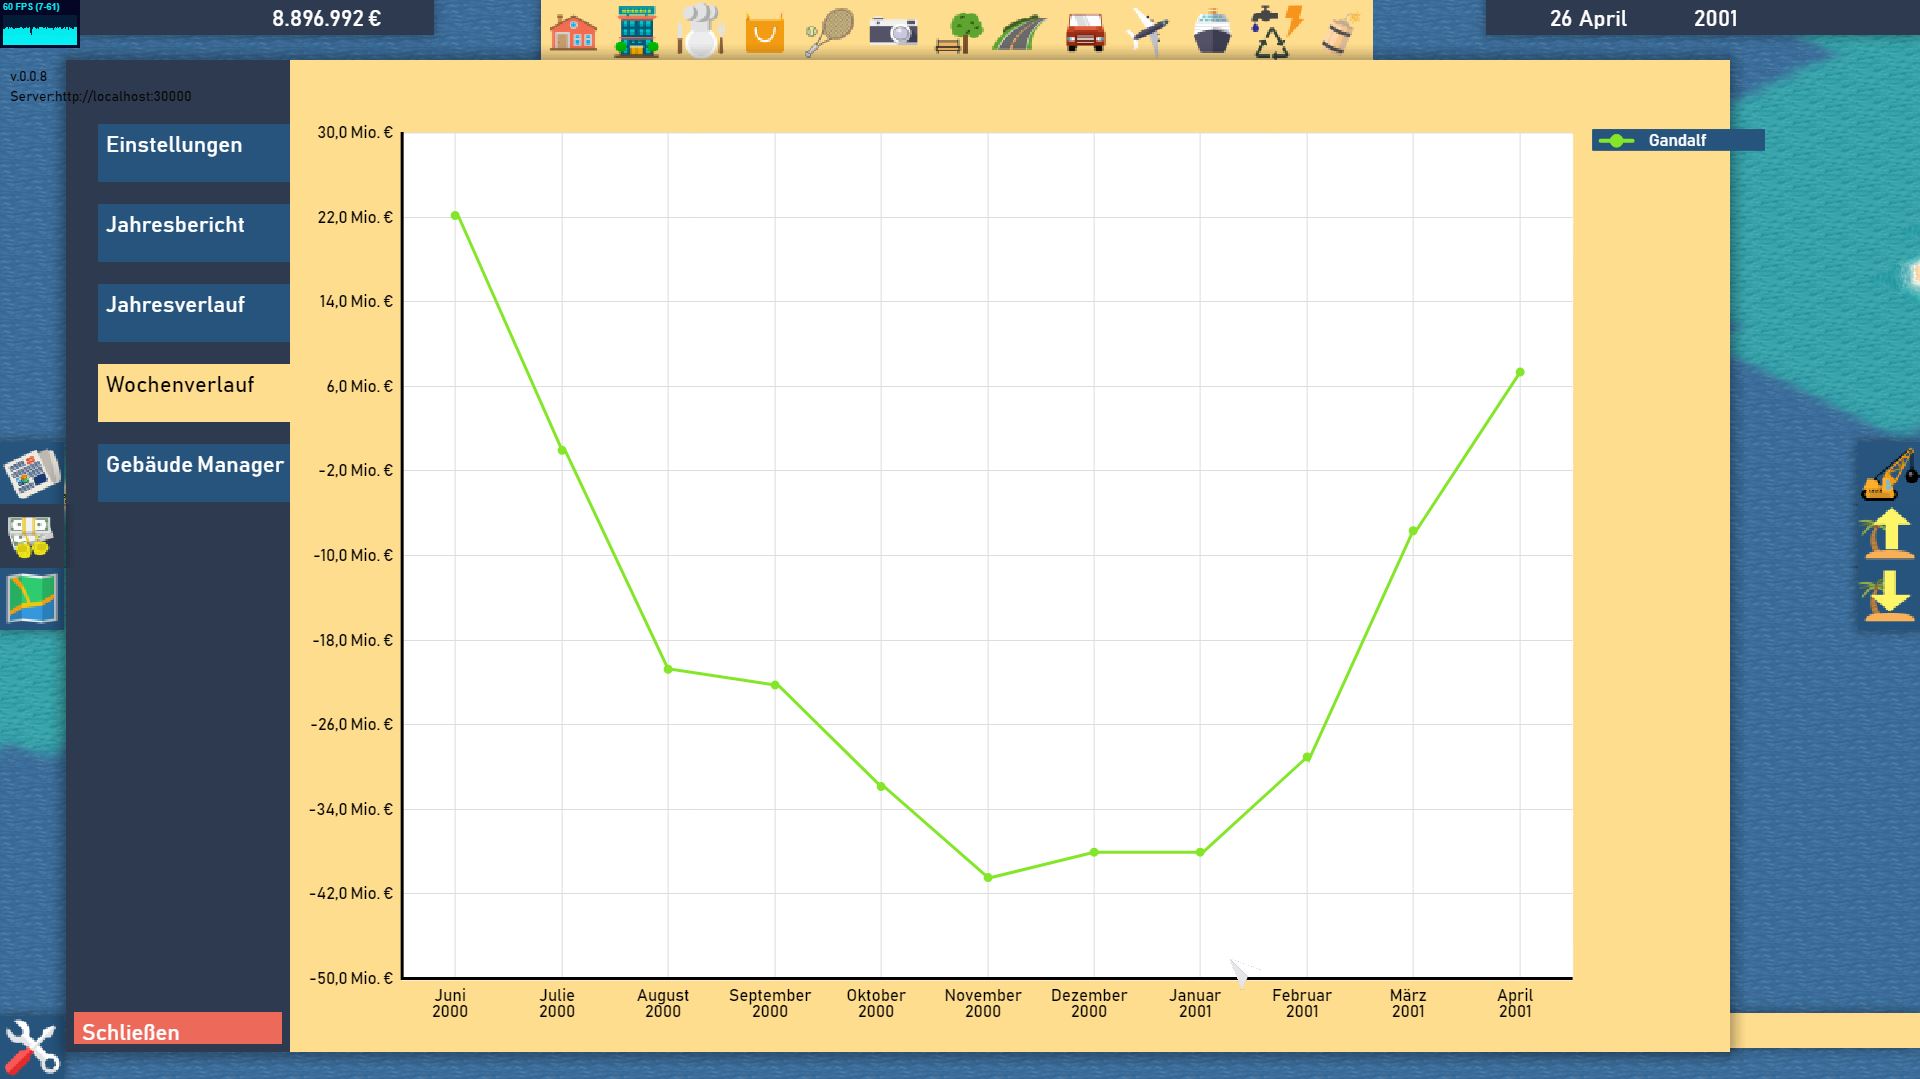
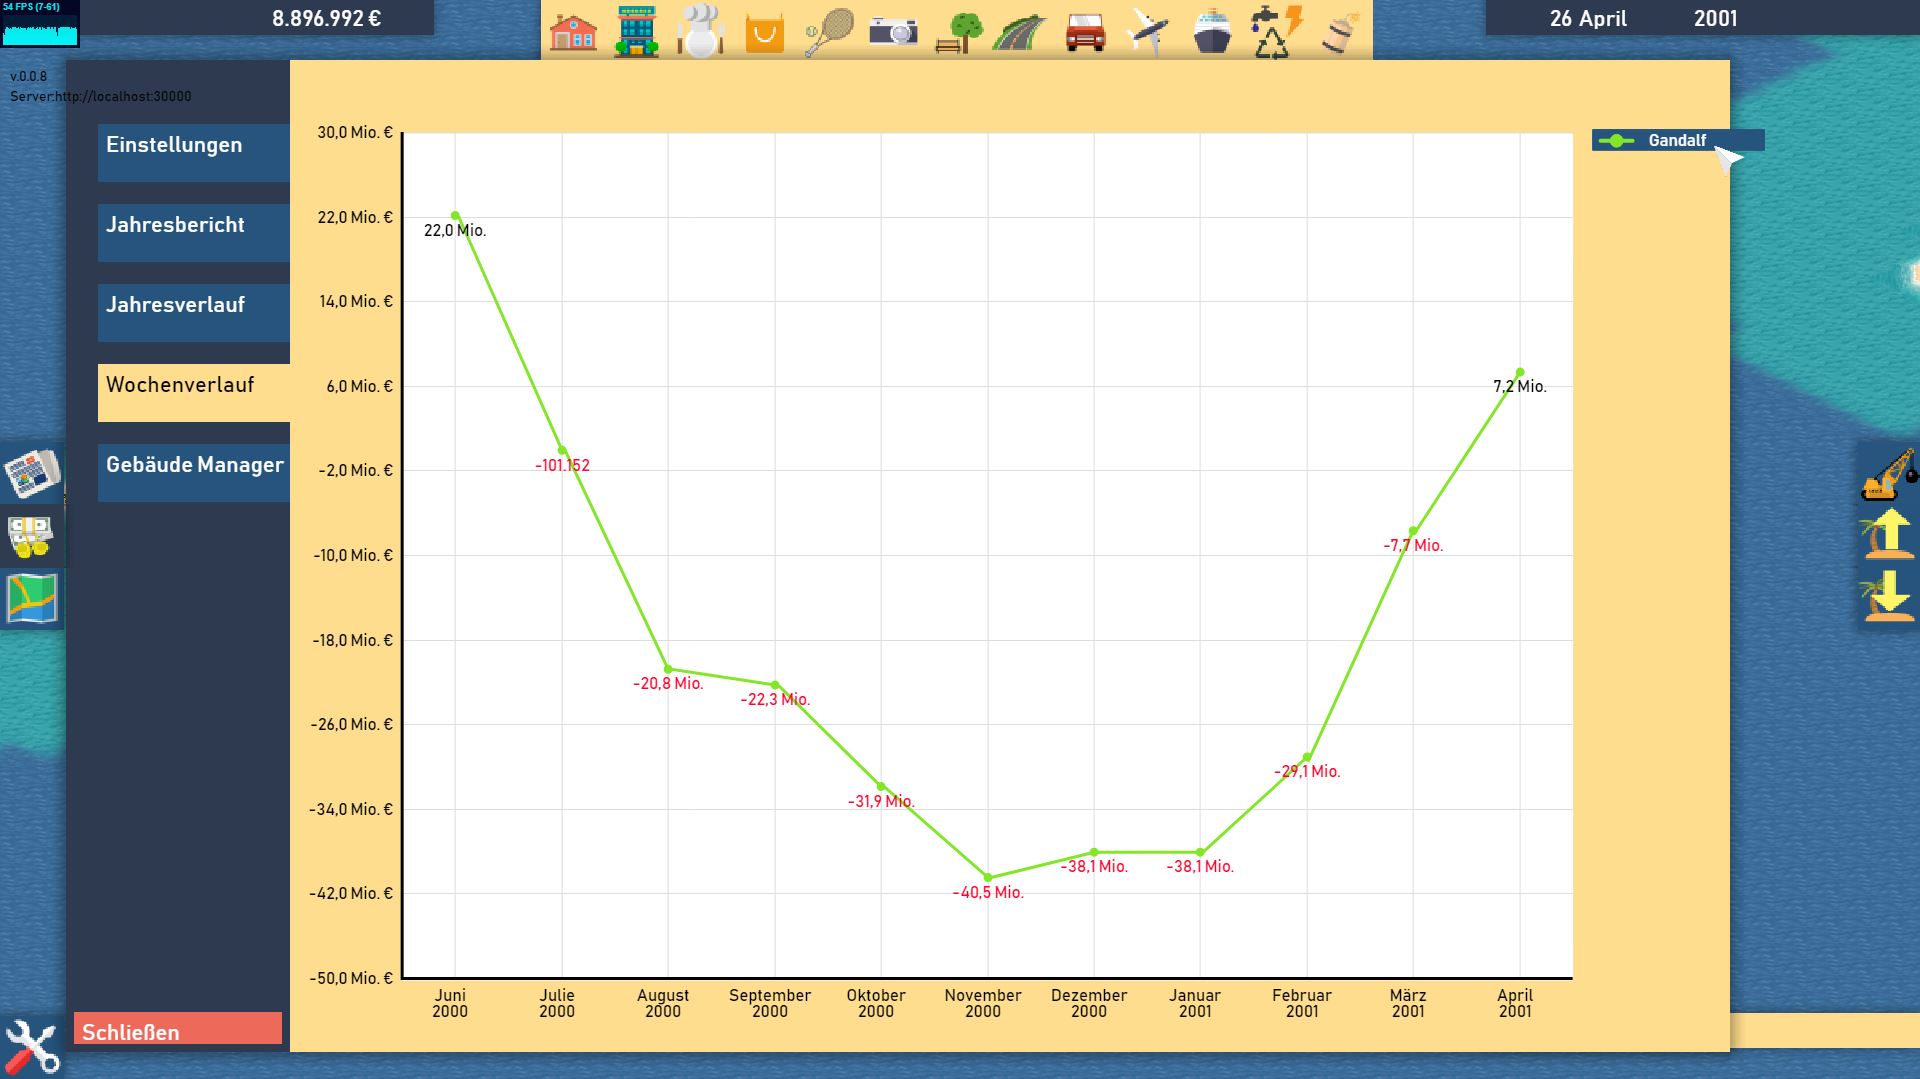
Since you don’t always see in detail in the table in which point you have how much money, there is the additional function to move the mouse over a name and thus display the exact numbers in the table.
There are two different tables. On the one hand, there is a monthly table that displays 12 months by month. On the other hand, there is an annual table which always shows 10 years at yearly intervals.
We have also created new textures. There we are currently working on a parking system that you can create individual parks from individual blocks.

We hope you like it.
Update Log:
-CLIENT: improved financial charts
-CLIENT: Created Parksystem
-SERVER: improved Buildings popularity function
-CLIENT/SERVER: javascript efficency corrections